首先安装prometheus,这步直接下载二进制包,解压,执行就可以了
在https://prometheus.io/download/下载最新版本的,下载后执行:
tar xzvf prometheus- .tar
cd prometheus...
nohup ./prometheus &
之后访问localhost:9090/graph,可以看到图表
配置node:
在https://prometheus.io/download/#node_exporter 下载最新版本的tar包
tar -xzf node_exporter-0.15.2.darwin-amd64.tar.gz
cd node_exporter-0.15.2.darwin-amd64
cp node_exporter-0.15.2.darwin-amd64/node_exporter /usr/local/bin/
nohup node_exporter &
prometheus架构
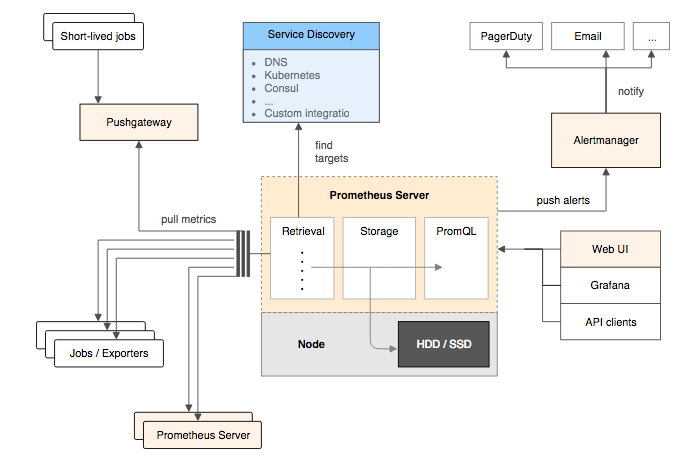
prometheus server都是通过pull的方式来获取监听的exports,这样会有server网络请求压力过高的问题,因为需要定时不停的发送http请求,去请求数据,那么压力都在server这里
prometheus是一个时序数据库,存储在本地的磁盘,这里就会有个问题,就是存储性能和存储方式类别,以及是否定时的清理文件,还有查询效率的问题,查询历史监控信息的效率问题
export是通过http暴露给server,让server来拉取数据,两种export,一种是集成好的,例如:cAdvisor,Kubernetes,Etcd,Gokit,对prometheus是支持的,另外一种是不支持prometheus,需要自己需要通过Prometheus提供的Client Library来写export,例如:Mysql Exporter,JMX Exporter,Consul Exporter。
Promql
在形式上,所有的指标(Metric)都通过如下格式标示:
<metric name>{<label name>=<label value>, ...}
其中以作为前缀的标签,是系统保留的关键字,只能在系统内部使用。标签的值则可以包含任何Unicode编码的字符。在Prometheus的底层实现中指标名称实际上是以name__=的形式保存在数据库中的,因此以下两种方式均表示的同一条time-series:
api_http_requests_total{method="POST", handler="/messages"}
{__name__="api_http_requests_total",method="POST", handler="/messages"}
PromQL支持使用=和!=两种完全匹配模式:
PromQL还可以支持使用正则表达式作为匹配条件,多个表达式之间使用|进行分离:
使用label=~regx表示选择那些标签符合正则表达式定义的时间序列;
反之使用label!~regx进行排除;
http_requests_total{code=~"400|200"}
区间向量表达式:
http_requests_total{handler="prometheus"}[1m]
除了使用m表示分钟以外,PromQL的时间范围选择器支持其它时间单位:
- s - 秒
- m - 分钟
- h - 小时
- d - 天
- w - 周
- y - 年
http_request_total{} # 瞬时向量表达式,选择当前最新的数据
http_request_total{}[5m] # 区间向量表达式,选择以当前时间为基准,5分钟内的数据
而如果我们想查询,5分钟前的瞬时样本数据,或昨天一天的区间内的样本数据呢? 这个时候我们就可以使用位移操作,位移操作的关键字为offset。
http_requests_total{handler="prometheus"} offset 1d
比较 http_requests_total > bool 100 和 http_requests_total > 100
在PromQL操作符中优先级由高到低依次为:
- ^
- *, /, %
- +, -
- ==, !=, <=, <, >=, >
- and, unless
- or
聚合操作
sum(http_requests_total)  //请求总量
count_values("count", http_requests_total) //以count为标签,个数
topk(5, http_requests_total)  //排序
quantile(0.5, http_requests_total)  //中位数
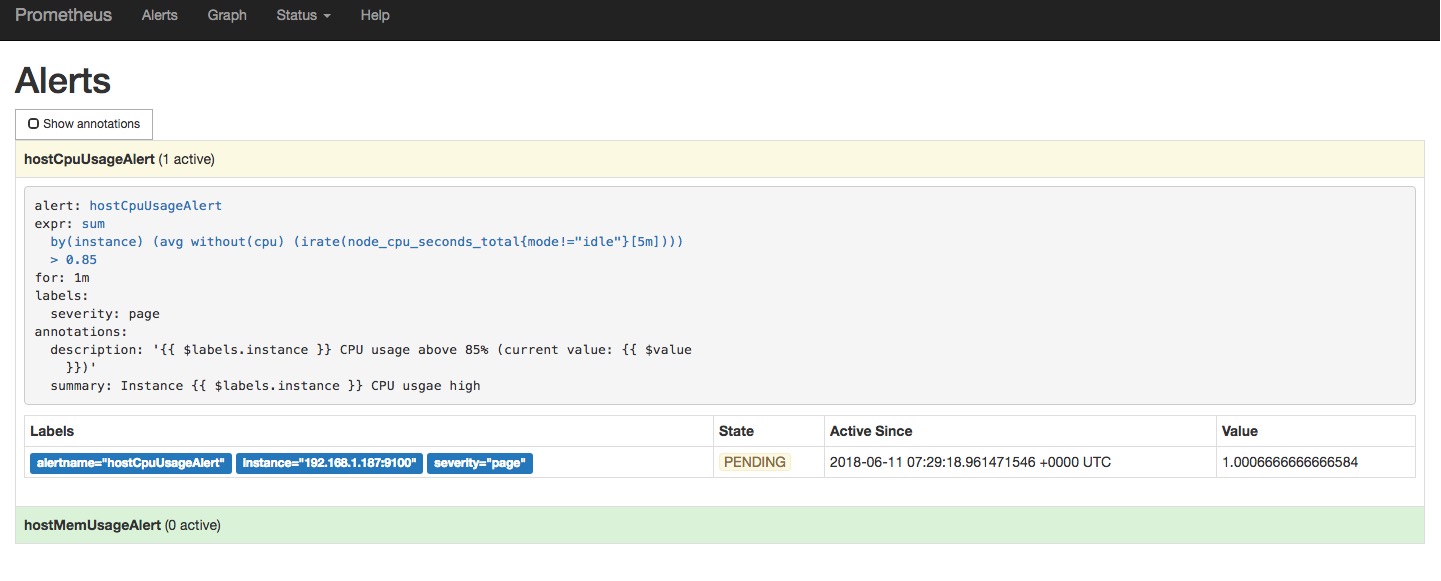
prometheus告警
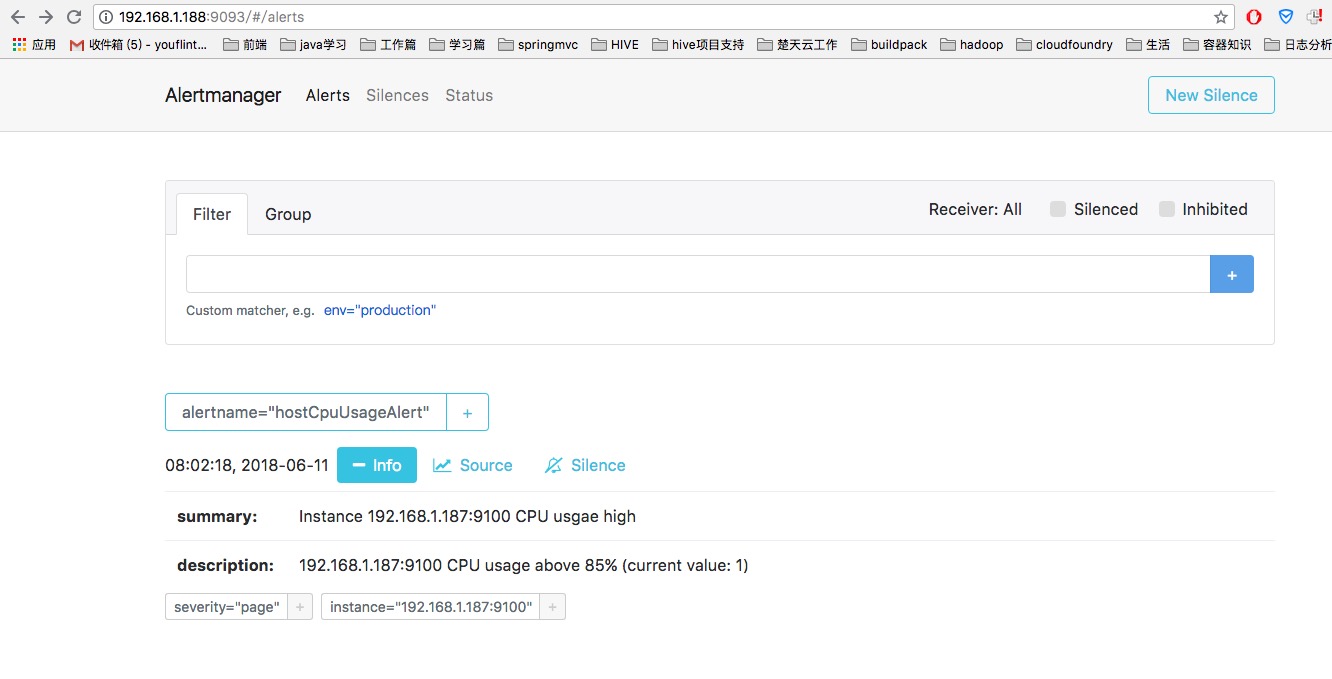
prometheus 自定义告警规则,如果触发告警规则,prometheus server把告警信息推送给单独的模块(AlertManager)进行处理
这是一条规则定义,如果触发,首先在(for)定义的时间范围内是pending状态,超过了这个时间,就是FIRING状态